SRS, Elo, and the market — walk-forward, not fitted in place.
The live Rankings board is opponent-adjusted EPA. This page is the separate power-rating research lane: weekly walk-forward SRS (the published research system), Elo, and archived market lines. Numbers below are committed out-of-sample results — not a claim that SRS beats the market.
Out-of-sample comparison
OOS · FBS-VS-FBS · WEEK 4+ · — GAMESMissing analysis/output/power_ratings_oos_comparison.csv
On the stricter market-matched confirmation split, latest-archived market lines often post a lower Brier than SRS. That is expected and published in the README — SRS remains the research system unless a challenger clears a predeclared gate.
Movement charts
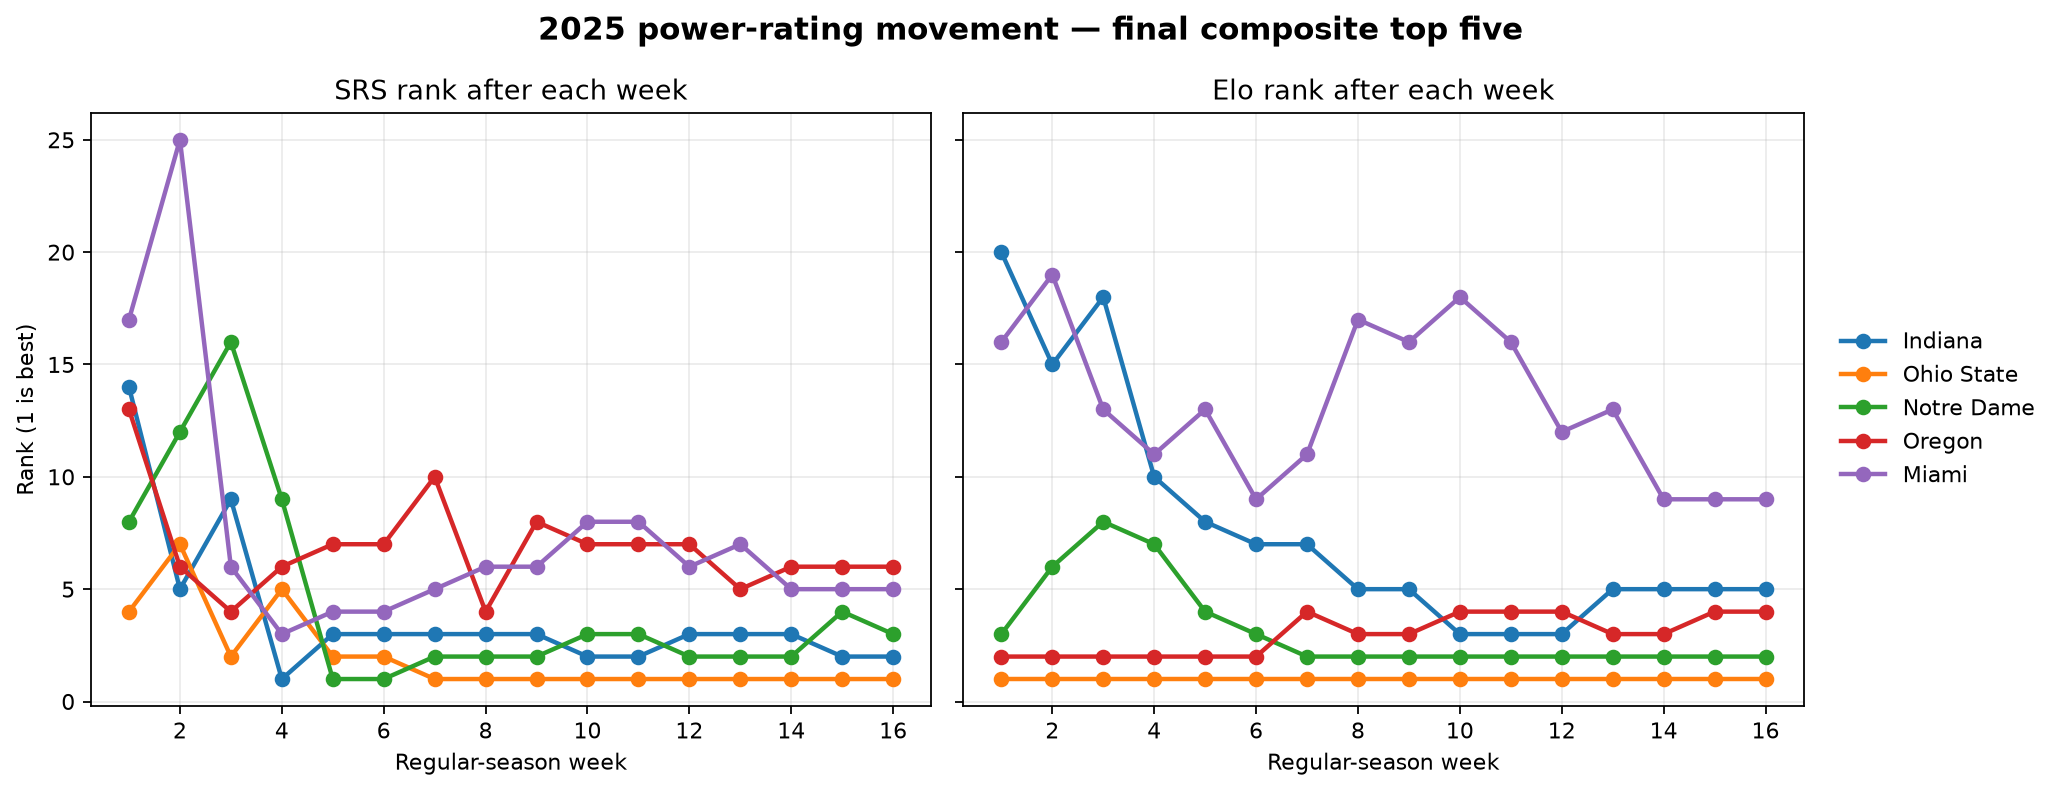
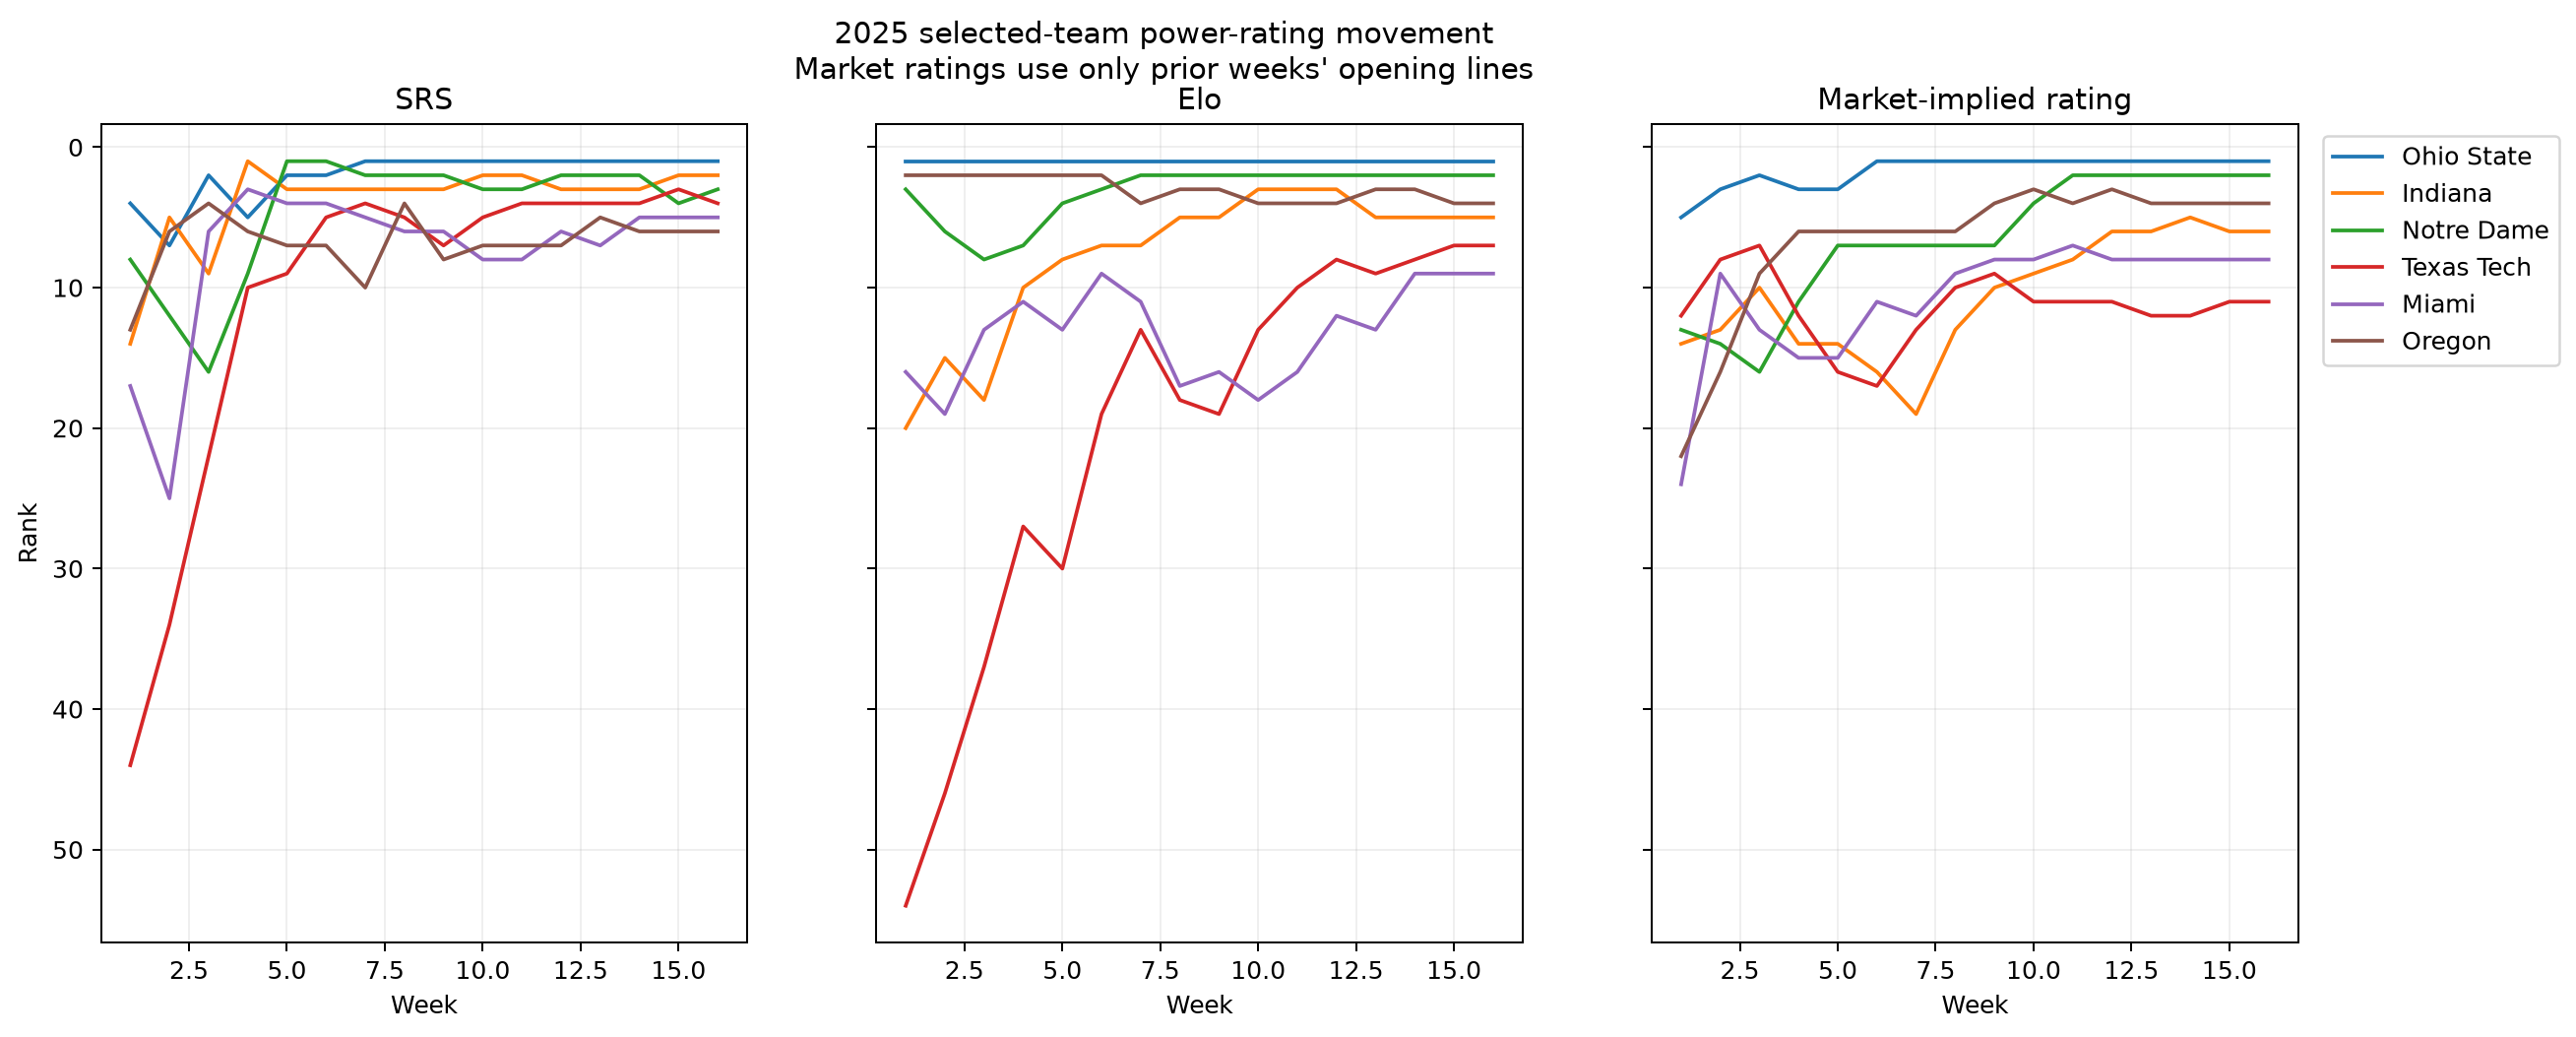
Charts staged by npm run prebuild from analysis/output/. Full file list: Research index.
Line drift
OPEN → LATEST ARCHIVED DRIFTConsensus median home margins from committed CFBD line archives. Drift is latest minus open. This is not a closing-line board and not the live Edges page.
| Matchup | Open | Latest archived | Drift | SRS proj |
|---|---|---|---|---|
| Kentucky @ Louisville | +4.5 | -1.5 | -6.0 | +4.8 |
| Wisconsin @ Minnesota | +2.5 | -2.5 | -5.0 | +0.3 |
| Clemson @ South Carolina | -2.5 | +2.5 | +5.0 | +1.9 |
| Florida State @ Florida | +2.5 | -1.5 | -4.0 | -2.8 |
| Georgia Southern @ Marshall | +6.5 | +10.5 | +4.0 | +9.9 |
| Ohio State @ Michigan | -5.5 | -9.5 | -4.0 | -11.3 |
| Texas Tech @ West Virginia | -20.5 | -24.5 | -4.0 | -20.7 |
| Western Michigan @ Eastern Michigan | -6.5 | -10.0 | -3.5 | -6.2 |
| Georgia @ Georgia Tech(N) | -13.0 | -16.5 | -3.5 | -10.9 |
| Utah @ Kansas | -13.5 | -10.0 | +3.5 | -13.1 |
| Penn State @ Rutgers | -10.5 | -14.0 | -3.5 | -9.9 |
| Arkansas State @ App State | +1.5 | -1.5 | -3.0 | +1.4 |
| SMU @ California | -10.5 | -13.5 | -3.0 | -14.3 |
| James Madison @ Coastal Carolina | -21.5 | -24.0 | -2.5 | -18.0 |
| UL Monroe @ Louisiana | +13.5 | +11.0 | -2.5 | +12.3 |
| Rice @ South Florida | +26.0 | +28.5 | +2.5 | +25.8 |
| Boise State @ Utah State | -3.8 | -1.5 | +2.3 | -3.3 |
| Missouri @ Arkansas | -2.5 | -4.5 | -2.0 | -1.8 |
| Toledo @ Central Michigan | -9.5 | -11.5 | -2.0 | -7.7 |
| Wyoming @ Hawai'i | +10.5 | +8.5 | -2.0 | +8.3 |
| Navy @ Memphis | +5.5 | +3.5 | -2.0 | +8.6 |
| Ole Miss @ Mississippi State | -9.5 | -7.5 | +2.0 | -7.9 |
| UNLV @ Nevada | -9.5 | -7.5 | +2.0 | -10.0 |
| Georgia State @ Old Dominion | +26.5 | +28.5 | +2.0 | +23.6 |
| UAB @ Tulsa | +7.5 | +9.5 | +2.0 | +5.6 |
| Army @ UTSA | +6.5 | +8.5 | +2.0 | +7.9 |
| Virginia Tech @ Virginia | +10.5 | +8.5 | -2.0 | +12.9 |
| Alabama @ Auburn | -5.5 | -7.0 | -1.5 | -3.5 |
| Bowling Green @ Massachusetts | -15.5 | -14.0 | +1.5 | -13.7 |
| Iowa @ Nebraska | -4.0 | -5.5 | -1.5 | -5.8 |
| LSU @ Oklahoma | +10.0 | +11.5 | +1.5 | +9.6 |
| Cincinnati @ TCU | +4.5 | +3.0 | -1.5 | +1.9 |
| Charlotte @ Tulane | +29.5 | +31.0 | +1.5 | +26.5 |
| Oregon State @ Washington State | +12.5 | +14.0 | +1.5 | +16.1 |
| UCF @ BYU | +18.5 | +17.5 | -1.0 | +17.8 |
| Ohio @ Buffalo | -6.0 | -7.0 | -1.0 | -5.0 |
| Wake Forest @ Duke | +3.5 | +2.5 | -1.0 | +2.0 |
| Western Kentucky @ Jacksonville State | -2.5 | -1.5 | +1.0 | +0.0 |
| Ball State @ Miami (OH) | +17.5 | +16.5 | -1.0 | +16.5 |
| Middle Tennessee @ New Mexico State | +4.5 | +3.5 | -1.0 | +7.4 |
| Temple @ North Texas | +19.5 | +20.5 | +1.0 | +19.5 |
| Fresno State @ San José State | -2.5 | -3.5 | -1.0 | -5.9 |
| Vanderbilt @ Tennessee | +3.5 | +2.5 | -1.0 | +1.4 |
| UCLA @ USC | +20.5 | +21.5 | +1.0 | +20.2 |
| Oregon @ Washington | -7.5 | -6.5 | +1.0 | -3.0 |
| Arizona @ Arizona State | -1.5 | -2.0 | -0.5 | -1.2 |
| UTEP @ Delaware | +5.0 | +4.5 | -0.5 | +2.9 |
| East Carolina @ Florida Atlantic | -6.5 | -7.0 | -0.5 | -7.7 |
| Colorado @ Kansas State | +17.0 | +16.5 | -0.5 | +12.0 |
| Kennesaw State @ Liberty | -2.0 | -2.5 | -0.5 | +0.3 |
| Maryland @ Michigan State(N) | +4.5 | +4.0 | -0.5 | -0.9 |
| Louisiana Tech @ Missouri State | +3.0 | +2.5 | -0.5 | +2.1 |
| North Carolina @ NC State | +7.5 | +7.0 | -0.5 | +9.6 |
| Kent State @ Northern Illinois | +4.5 | +5.0 | +0.5 | +5.6 |
| Iowa State @ Oklahoma State | -14.5 | -14.0 | +0.5 | -16.4 |
| Miami @ Pittsburgh | -7.0 | -6.5 | +0.5 | -5.3 |
| Troy @ Southern Miss | +6.5 | +7.0 | +0.5 | +3.1 |
| South Alabama @ Texas State | +9.0 | +9.5 | +0.5 | +8.4 |
| Air Force @ Colorado State | -2.8 | -2.5 | +0.3 | -2.6 |
| Houston @ Baylor | +2.5 | +2.5 | +0.0 | +1.4 |
| Northwestern @ Illinois | +7.0 | +7.0 | +0.0 | +7.7 |
| San Diego State @ New Mexico | -1.5 | -1.5 | +0.0 | -1.6 |
| Indiana @ Purdue | -28.5 | -28.5 | +0.0 | -23.9 |
| Florida International @ Sam Houston(N) | -10.5 | -10.5 | +0.0 | -9.9 |
| Notre Dame @ Stanford | -32.5 | -32.5 | +0.0 | -24.0 |
| Boston College @ Syracuse | -3.0 | -3.0 | +0.0 | +3.9 |
| Texas A&M @ Texas | -2.5 | -2.5 | +0.0 | -2.8 |
Model output, not betting advice. Open and latest-archived margins come from committed CFBD line archives (median across providers). latest_archived is not a historical closing line. Drift = latest_archived_home_margin − open_home_margin.